
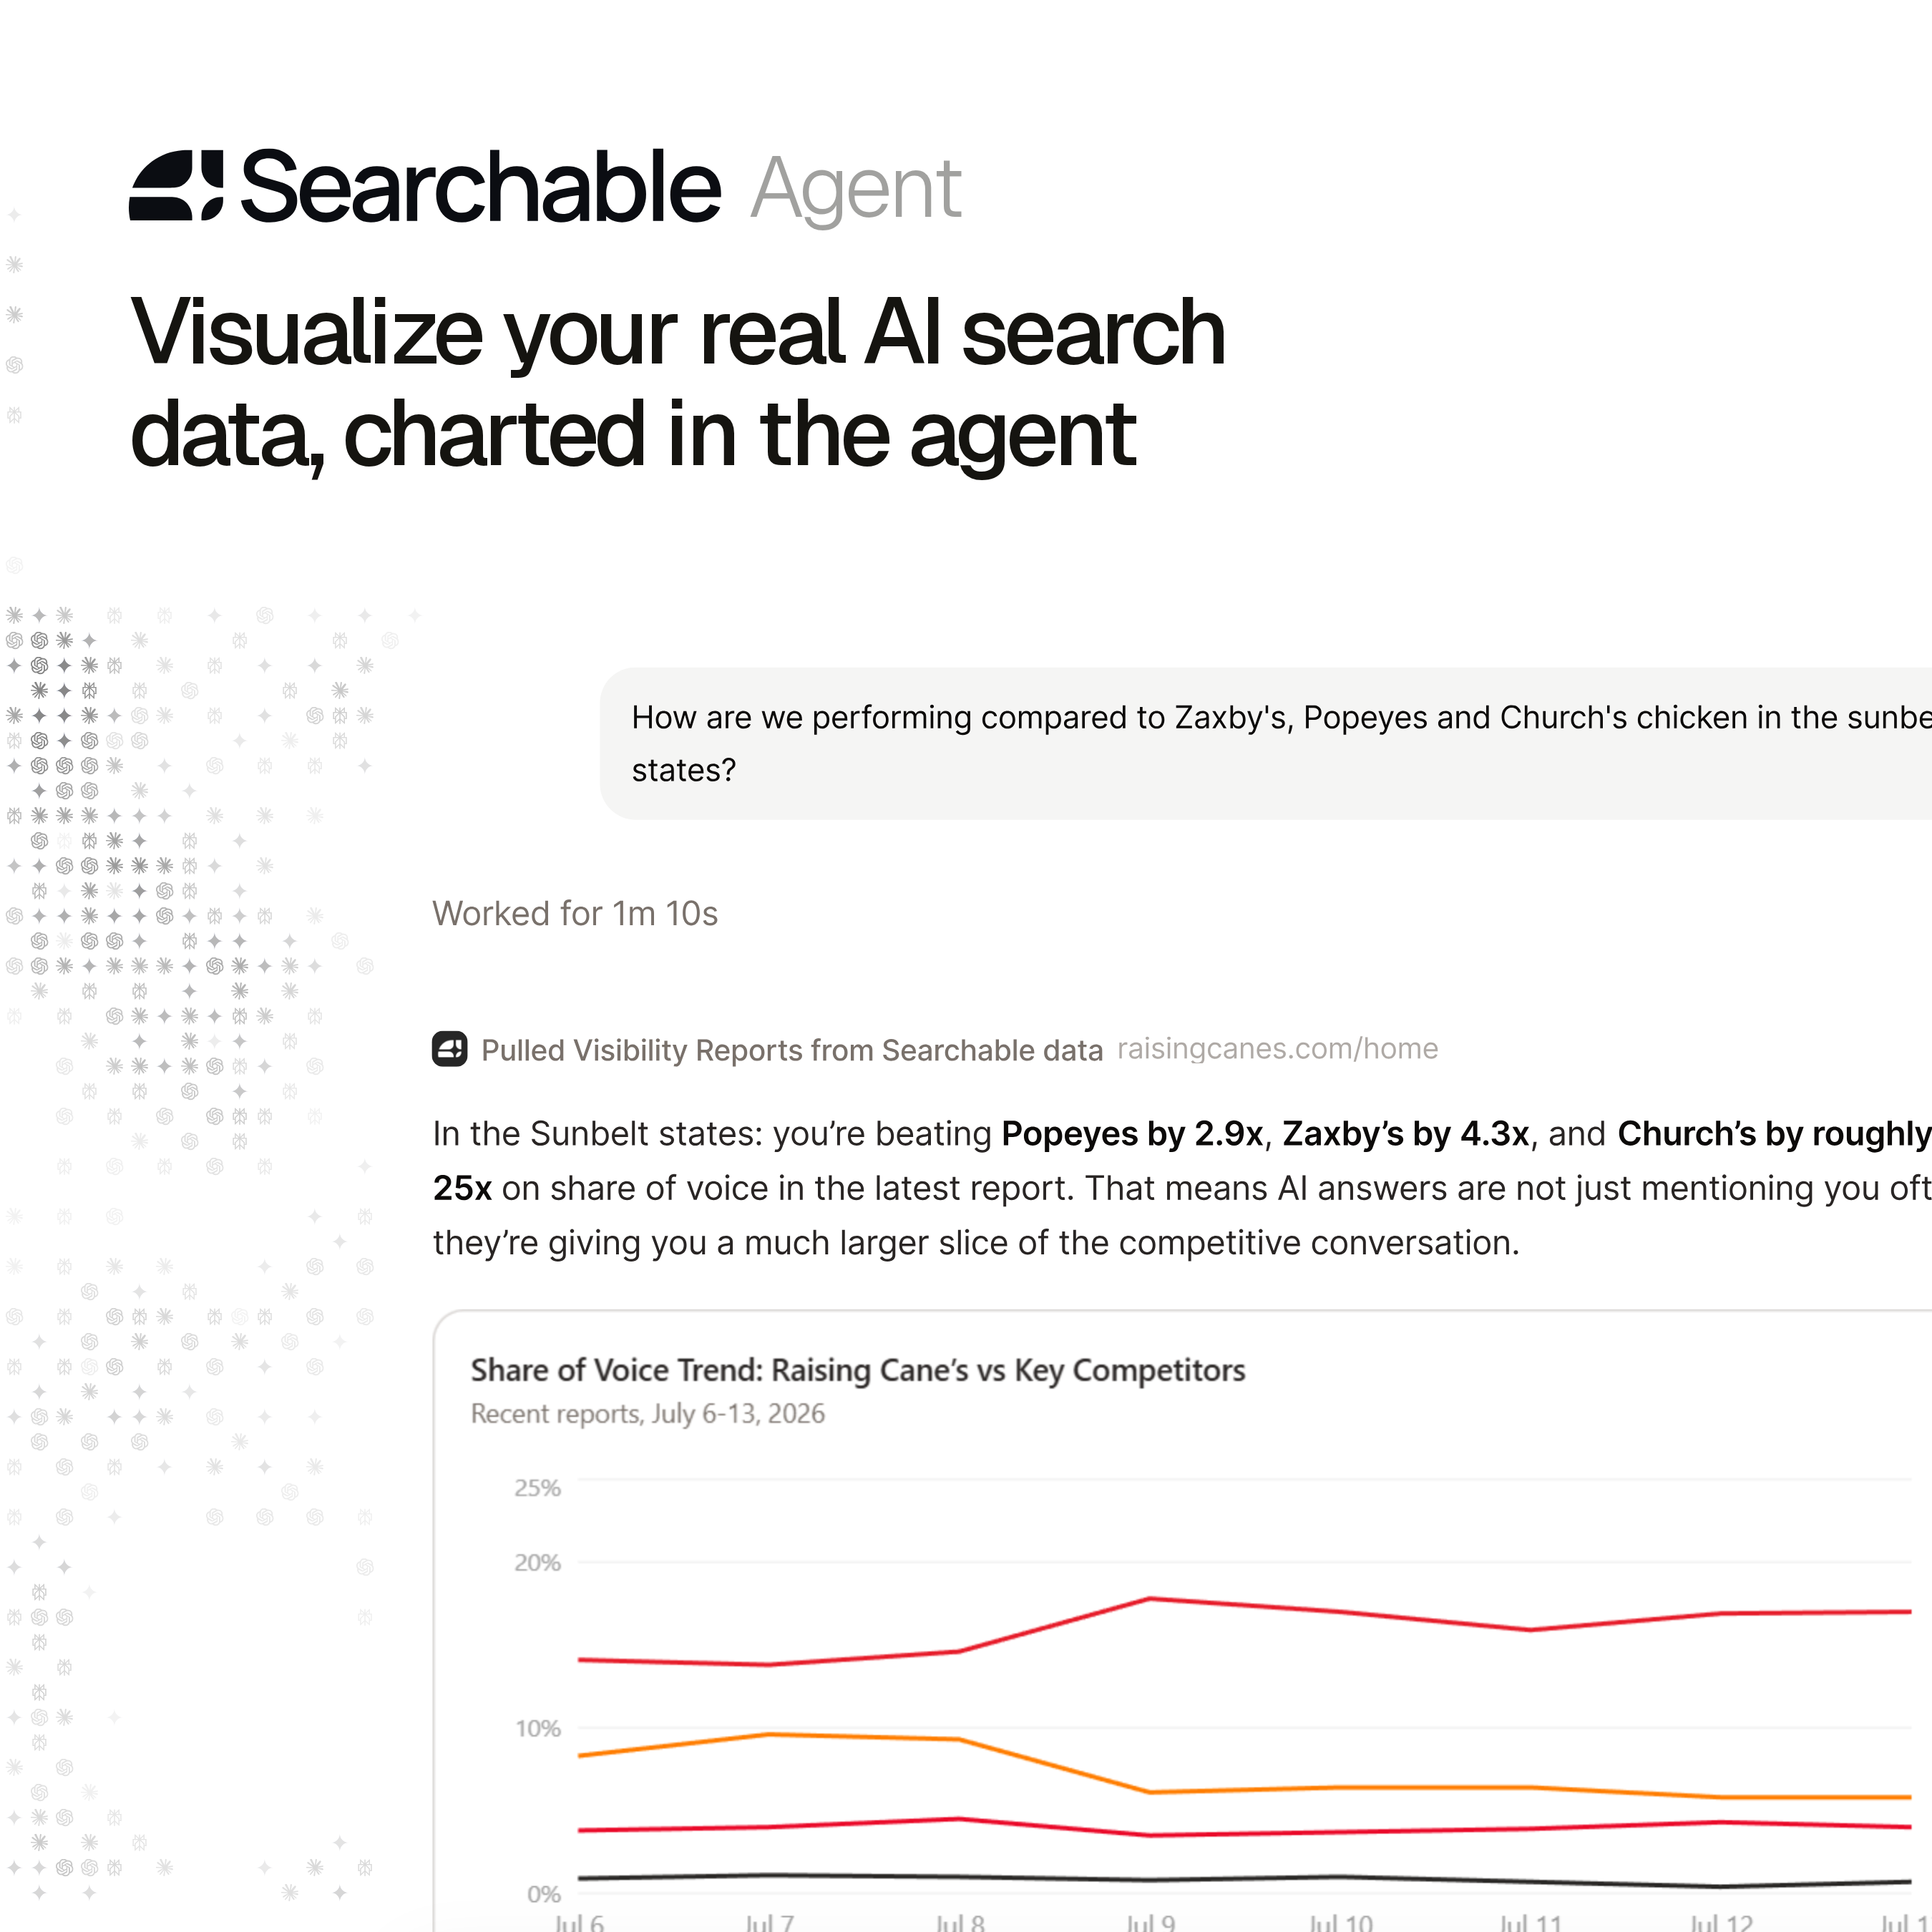
The Searchable Agent now visualizes your AI search data inline. Ask a question about visibility, competitors, prompts, citations, or share of voice, and the Agent pulls the relevant Searchable data, runs the analysis, and answers with a live chart, table, or funnel right inside the conversation. Charts come in bar, line, area, pie, donut, and funnel form, with branded colors for you and your competitors, and export to CSV or image.
The Searchable Agent has become the fastest way to understand how your brand shows up across AI search.
It can analyze visibility, investigate competitors, dig into the prompts people actually ask, trace where citations come from, and work across all of your Searchable data in ways that would previously have meant jumping between dashboards.
As people leaned on the Agent for more of that work, one pattern kept coming up: the answer was rarely just a number. Someone would ask how they were doing against a competitor, and the useful version of that answer was a trend over time, a breakdown by platform, or a share-of-voice split — something you could actually see.
Until now, that meant taking the Agent's answer, opening a dashboard, or exporting the data into another tool to build the chart yourself.
Data visualization removes that step. Now you can ask the question and get the answer back as a live chart, table, or funnel inside the conversation.
What is Agent Data Visualization?
Data visualization lets the Searchable Agent answer your questions with charts, tables, and funnels directly in the chat transcript — not off in a separate panel you have to go find.
You ask a question about your AI search performance, and the Agent pulls the relevant Searchable data, runs the analysis, and visualizes the answer inline.
The Agent can render:
- Bar and stacked bar charts
- Line and area charts
- Pie and donut charts
- Tables
- Funnels
Series are colored by brand — your own colors and favicons alongside your competitors' — so a chart is readable the moment it appears. And every visualization can be exported: download the data as CSV, save the chart as an image, or copy it straight into your report.
This is more than a prettier answer. It turns a conversation with the Agent into something you can act on and share without leaving the chat.
Questions Worth Charting
The most useful charts are the questions you already ask about AI search — the ones where a trend or a breakdown tells you far more than a single figure.
For example, you could ask the Agent to:
Compare your performance against top competitors
"How are we performing against our top competitors in ChatGPT and Google AI Overviews?"
The Agent pulls the relevant visibility data, compares you to the competitors that matter, and returns a chart you can read at a glance — with each brand in its own color — instead of a wall of numbers.
Track how your share of voice is changing
"How has our share of voice changed against our top competitors?"
Rather than eyeballing a table, you get a trend over time that shows whether you are gaining or losing ground, and against whom.
See which topics are moving your visibility
"Which topics are driving our visibility up or down?"
The Agent breaks visibility down by topic and visualizes the movers, so you can quickly see where you are winning and where attention is slipping.
Find where you win across engines
"Where are we winning across ChatGPT, Claude, and Perplexity?"
Get a per-platform breakdown that shows which answer engines already favor you and which ones are worth the next push, all in a single chart.
Understand your citations and mentions
Ask where your citations come from, how mentions break down by source, or how a prompt funnel converts, and the Agent returns the matching chart, table, or funnel — built from your live Searchable data.
Why Charts in the Chat Matter
Your AI search data is a lot more useful when you can actually see what it is telling you.
The teams getting the most out of Searchable are not just pulling metrics — they are looking for the story in the data: the trend line that is bending the wrong way, the competitor quietly gaining share, the platform where they are already ahead.
That story is much easier to spot in a chart than in a table, and much easier to share with the rest of your team than a screenshot of raw numbers.
By putting visualization inside the Agent, the analysis and the picture live in the same place. You ask a question, you see the answer, and you can drop it straight into a report or a Slack message. No digging through dashboards. No exporting data into another tool. No manually building the chart yourself.
The result is a faster loop from question to insight to decision — which is the whole point of having an agent for AI search in the first place.
How to Get Started
Data visualization is live in the Searchable Agent today, and there is nothing to switch on.
Open the Searchable Agent and ask a question about your AI search performance — your visibility, your competitors, your prompts, your citations, or your share of voice. When a chart is the clearest way to answer, the Agent will build one inline.
From there you can refine it in conversation, ask for a different view, then export the data as CSV or save the chart as an image to use wherever you need it.
Just ask the question.
